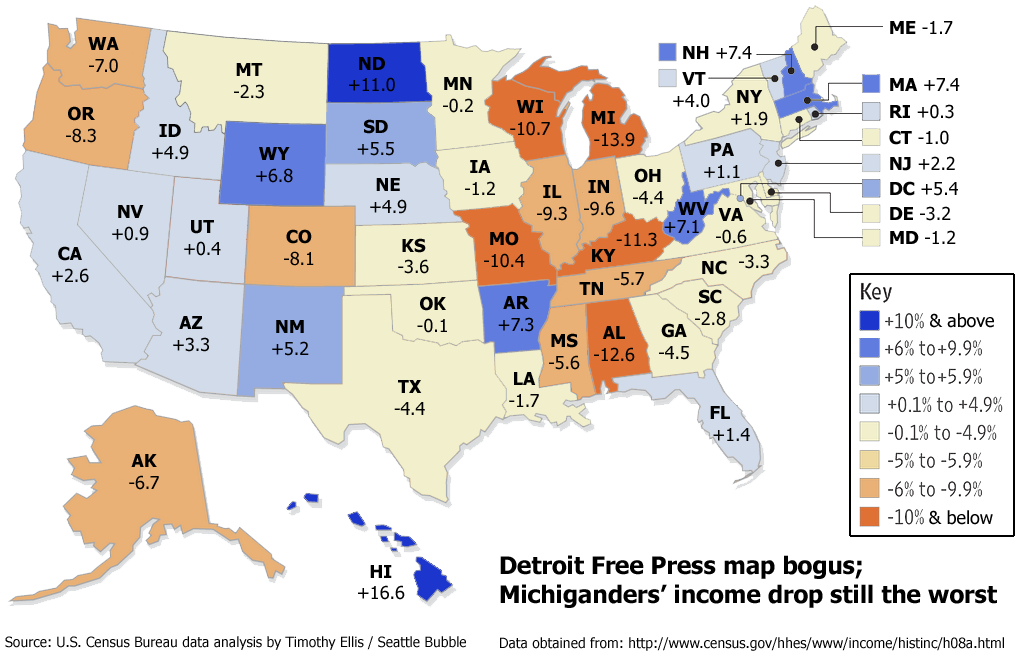
This is an example of a stistitical map. These types of maps use statistics from numerical data to represent information. In this picture, the statistics are those of income drops within all 50 states; it also goes to show that Michigan had the lowest income drop.
No comments:
Post a Comment